


The blockchain analytics firm Glassnode shared its weekly report, which features various key metrics and on-chain data related to the leading cryptocurrency.
Spot Metrics
The spot price rebounded strongly over the past week, after re-testing the sub-$114,000 level and climbing back towards $121,000. This brought momentum back into the spot market, with several sectors showing signs of renewed user activity, although a close eye is to be kept on the conditions.
The Relative Strength Index (RSI), which measures the speed and change of price movements by calculating the average gains & losses over (usually) 14 days, has increased to 47.5, marking a 14.5% gain. This signals a strengthening investor interest and a potential bullish shift; however, as the RSI is below the midpoint, it warrants caution as the momentum needs to hold to confirm the trend.
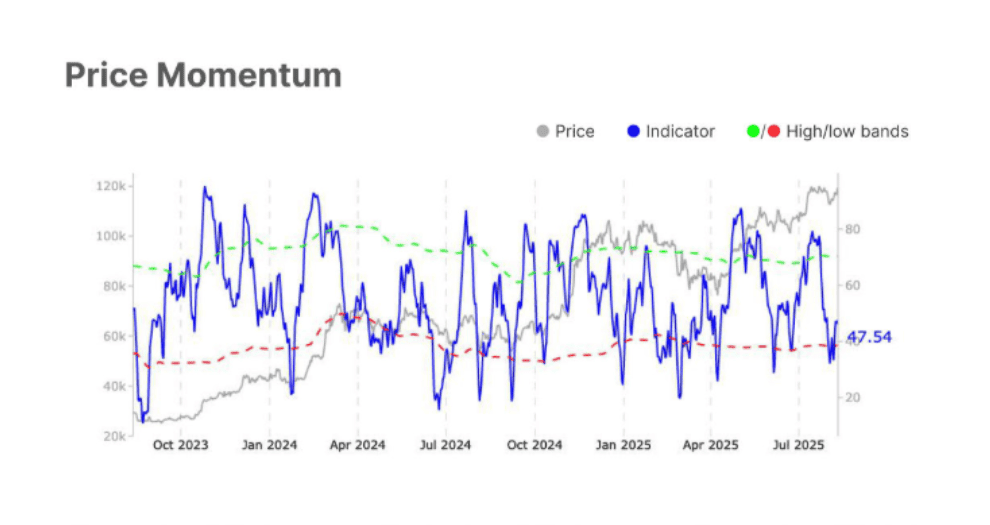
Meanwhile, Spot Volume decreased from $7.3 billion to $5.7 billion, representing a 22% reduction, which indicates reduced market engagement and fewer participants compared to previous weeks.
Futures Metrics
Open Interest, the benchmark that measures the total number of active positions, has decreased to $44.1 billion from $44.6 billion, indicating a slight reduction in leveraged trading, likely due to profit-taking or liquidations.
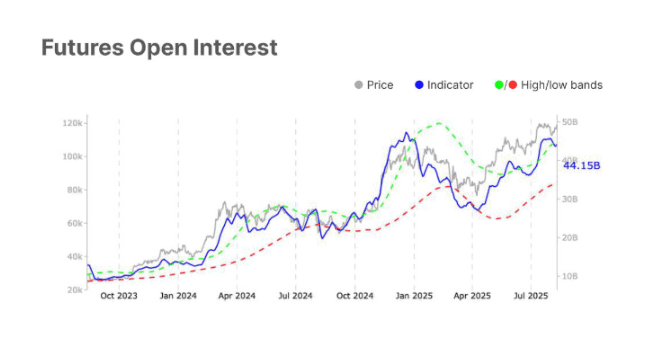
The Funding Rate (fees paid by longs to shorts, allowing them to maintain their positions) specifically for long positions declined by 2% to $2.9 million. While this hints at a cooling bullish sentiment, the demand for these positions remains high.
Options Metrics
Open interest in the options market has increased compared to futures, reaching $42.4 billion. This represents a 6.74% increase from last week and can be attributed to growing market engagement, driven by speculative positions and various trading strategies.
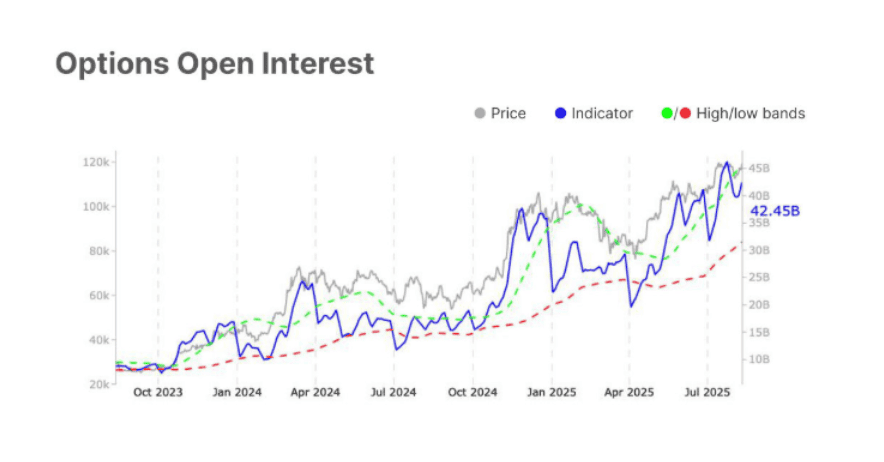
The Volatility Spread (measures whether options overprice risk; higher readings indicate greater fear) has dropped to 10.45% from 31.97% last week, signaling that traders are expecting less volatility.
US Spot ETFs
It’s looking good on the ETF markets, with the weekly net flows (the difference between money going in and out of the funds) rising over 54% from -$686 million to -$311 million, which is a significant reduction in outflows. This could lead to the start of a new wave of accumulation.
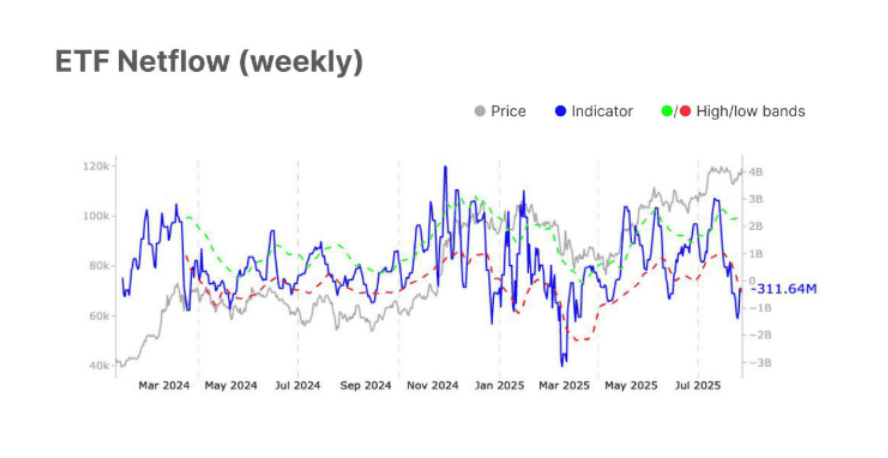
By contrast, the Trade Volume (overall trading activity over a specific period) has experienced a 27.7% drop to $13.7 billion, which could indicate a consolidation phase within the market or seller exhaustion.
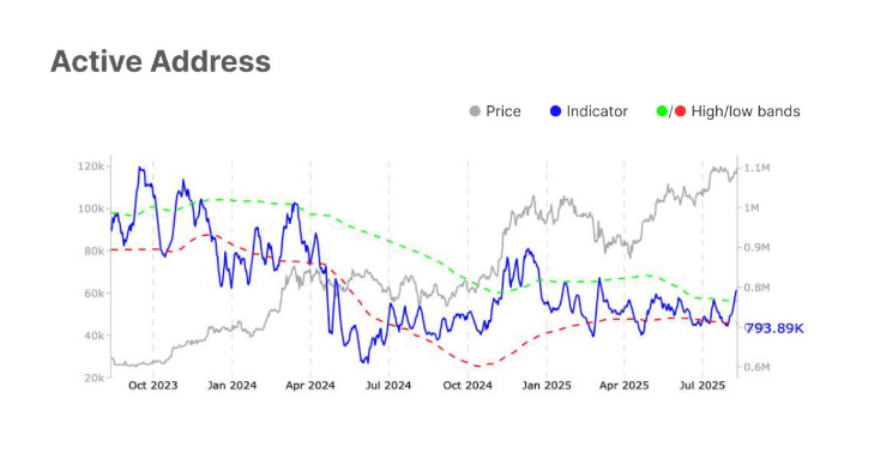
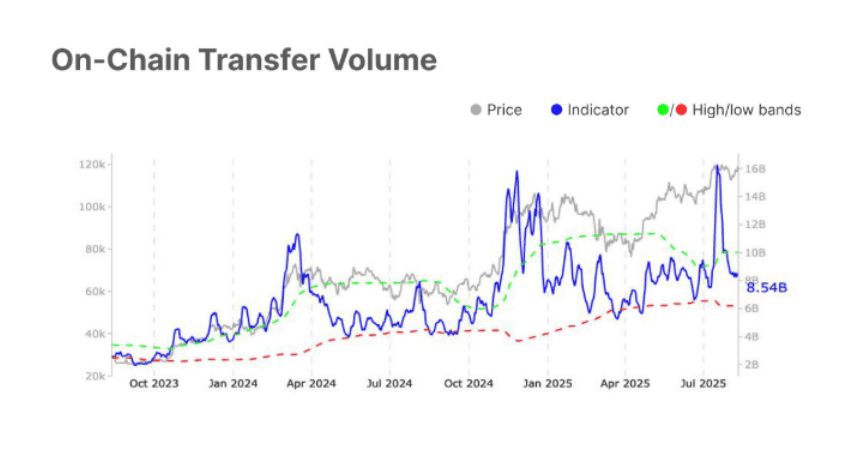
Fundamental Metrics
The daily active address count has risen to 793,000, indicating elevated user engagement on the network, likely driven by recent price movements. If this keeps up, a more active phase may be on the horizon.
On-chain transfer volume, a metric that tracks the total amount of transactions conducted directly on the blockchain, has dropped slightly from $8.6B to $8.5B, but remains steady. This follows a recent sharp decline, suggesting renewed interest.
Binance Free $600 (CryptoPotato Exclusive): Use this link to register a new account and receive $600 exclusive welcome offer on Binance (full details).
LIMITED OFFER for CryptoPotato readers at Bybit: Use this link to register and open a $500 FREE position on any coin!