


Bitcoin price dropped below the $110,000 threshold again today after it made an attempt to climb past $110k. Analysts discovered that the 30-day moving average has fallen to its lowest level.
Summary
- Bitcoin price fell below $110,000 ass its 30-day moving average plummets to the lowest level since 2018.
- The downward trend may be a result of the Fed-fueled rally coming to a close, as BTC faces significant selling pressure.
On August 27, Bitcoin (BTC) price fell from its earlier peak at $117,279 last Friday and stood around $109,526, slipping beneath the $110,000 threshold in what can only be described as a flash crash. It is currently trading hands at around $110k as it attempts to climb back to earlier levels.
Not only that, the 30-day moving average for the buy or sell ratio has hit its lowest level since May 2018, as noted by Crypto Quant analysts. This could indicate that the Bitcoin market is facing significant selling pressure in the short term.
While optimism around potential U.S. interest rate cuts from the Fed Chair’s Jackson Hole speech briefly fueled Bitcoin’s rally earlier this month, that momentum has now faded. Without a fresh catalysts, Bitcoin could retest the $100,000 level or lower before finding stability again.
Bitcoin price analysis
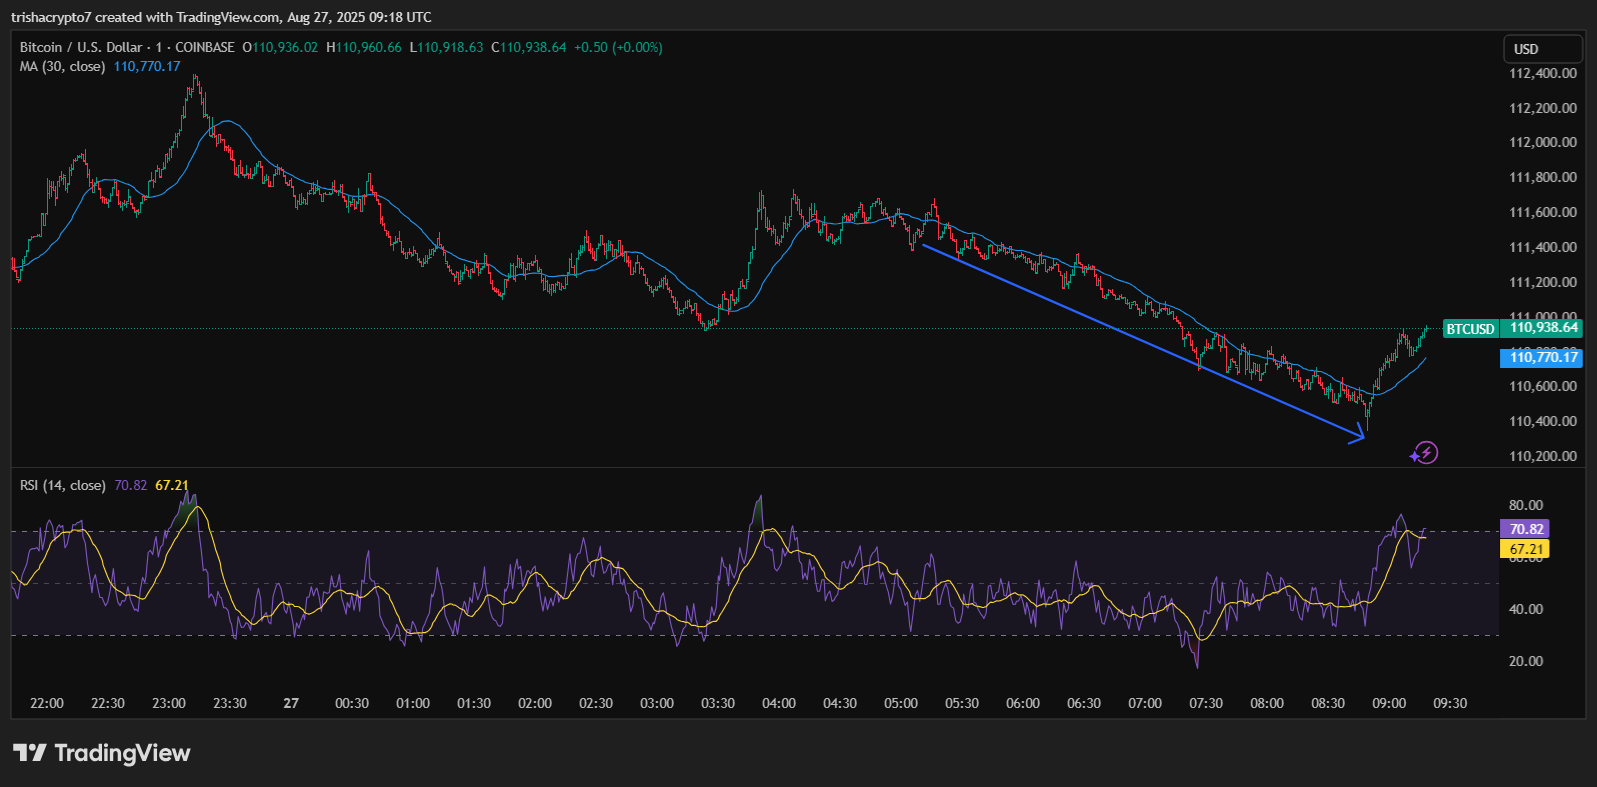
As seen on the chart, Bitcoin price experienced a steady decline, breaking well below the 30-day moving average which acted as resistance throughout the downtrend.
This bearish trend persisted until it reached a low near $110,200 before showing signs of a potential reversal. Bitcoin price has since rebounded sharply, breaking out of the descending channel and climbing above the MA marked by the blue line. It is currently trading around $110,938.
Meanwhile, the Relative Strength Index shows an oversold condition around the bottom of the price move, followed by a strong upward momentum. So far, the RSI has crossed above the 70 level, currently reading 70.82, suggesting the asset is now in overbought territory. This could indicate a short-term exhaustion of bullish momentum, possibly leading to a brief pullback.
However, the strong rebound and the breakout from the channel suggest bulls are regaining control, and if the price holds above the MA, a potential recovery could be anticipated.
Why did Bitcoin crash briefly?
Just before the crash, the RSI reached a peak of over 70, indicating that Bitcoin was in the overbought zone. This likely triggered profit-taking and short-term traders exiting positions, which accelerated the drop.
Considering the rally had run out of steam after the Fed’s speech, the declining trend on Bitcoin price continued until buying interest was revived around the $110,200 mark. Not long after it entered oversold territory, it was able to recover briefly from the temporary dip.
The crash itself was also driven large whale sell-off that triggered the flash crash and mass liquidations across the market. On August 26, a single wallet reportedly sold around 24,000 BTC, sparking forced liquidations of more than $940 million in Bitcoin, Ethereum, and other cryptocurrencies