


BNB price has slipped below its $750 weekly pivot and two daily moving averages, leaving the $700–$710 support zone in focus as analysts point to further downside after its rejection near $800.
Summary
- BNB price traded near $729 after reaching a daily low of $708.64 on Binance.
- Daily moving averages at $744.55 and $761.09 remained above the token’s price.
- Analysts identified $700–$710 as support, with $680–$690 possible if that zone breaks.
- CoinGlass showed prominent liquidation concentrations around $765–$766, above the current trading range.
TradingView’s Binance BNB/USDT daily chart showed the token trading at $728.66 on Oct. 15, following a decline to $708.64 and a rebound of roughly 2.8% from that low. The recovery left BNB below its daily high of $732 and beneath the moving averages it had crossed during the recent pullback.
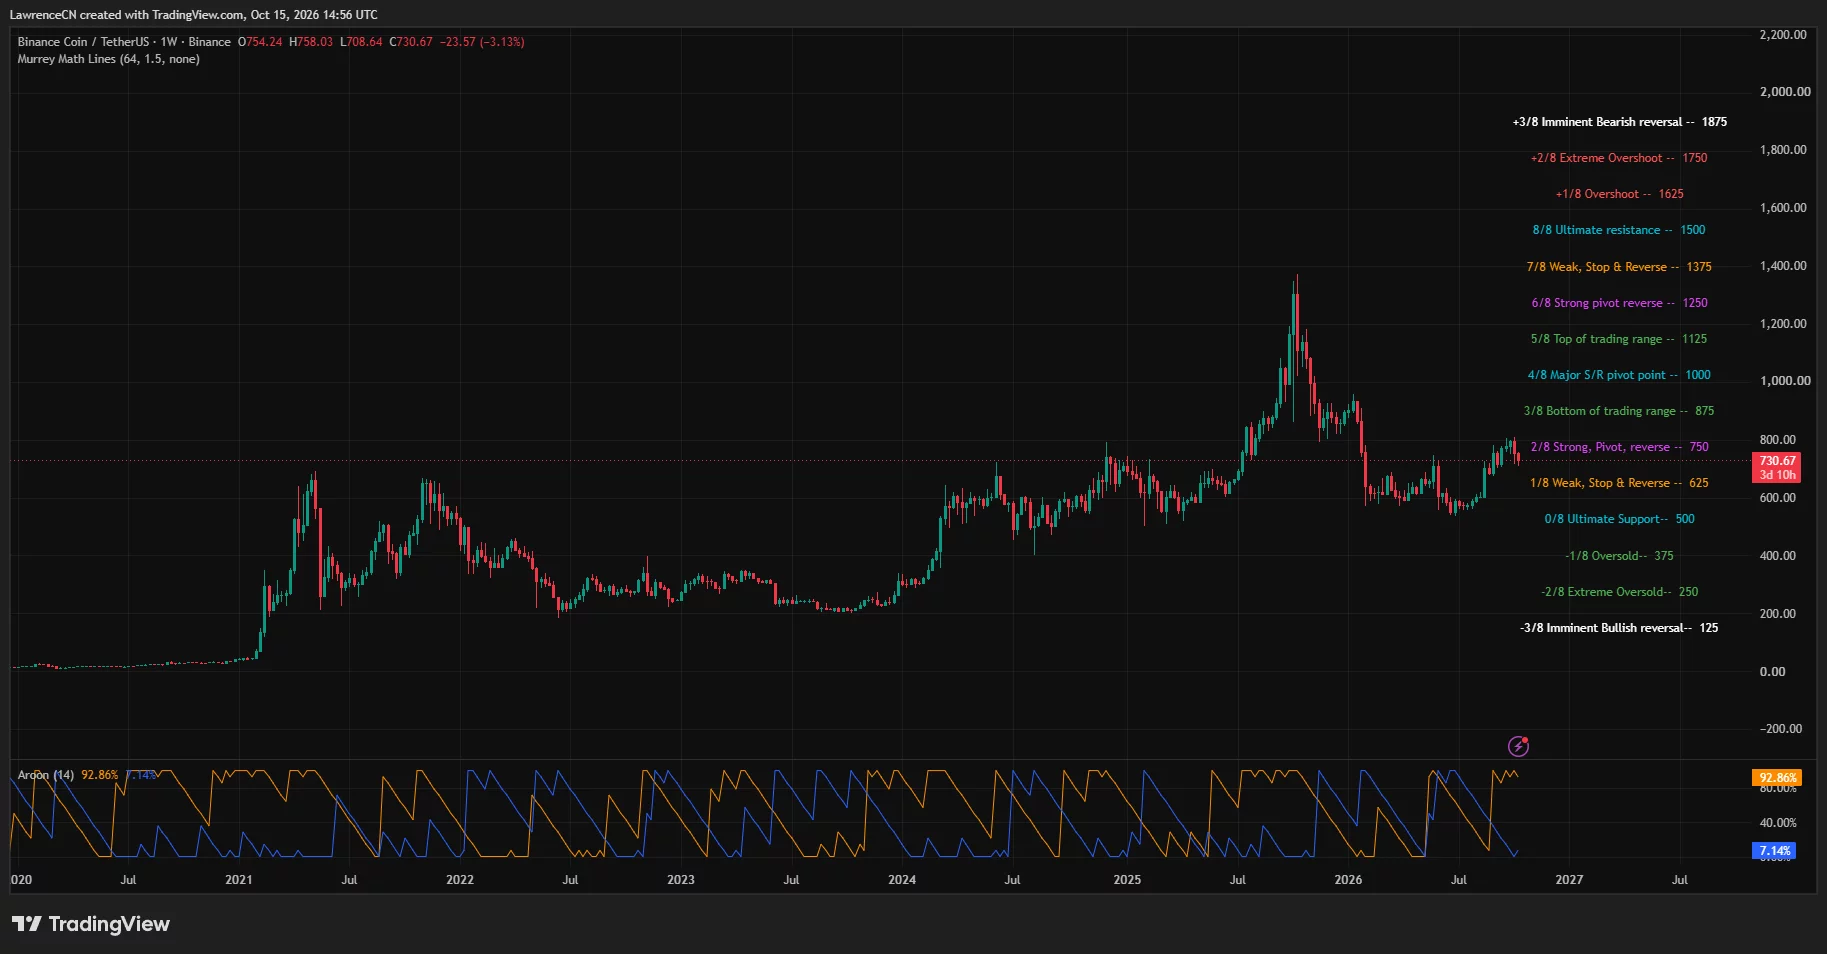
On the weekly chart, BNB stood near $730.67, down 3.13% from the week’s opening price of $754.24. Its weekly trading range stretched from $708.64 to $758.03, putting the token below the $750 pivot identified by the chart’s Murrey Math indicator.
BNB trades below its $745–$761 moving-average band
TradingView’s daily moving-average ribbon placed the 20-day simple moving average at $761.09 and the 50-day average at $744.55. BNB traded below both, following its retreat from the late-September and early-October highs near $800.
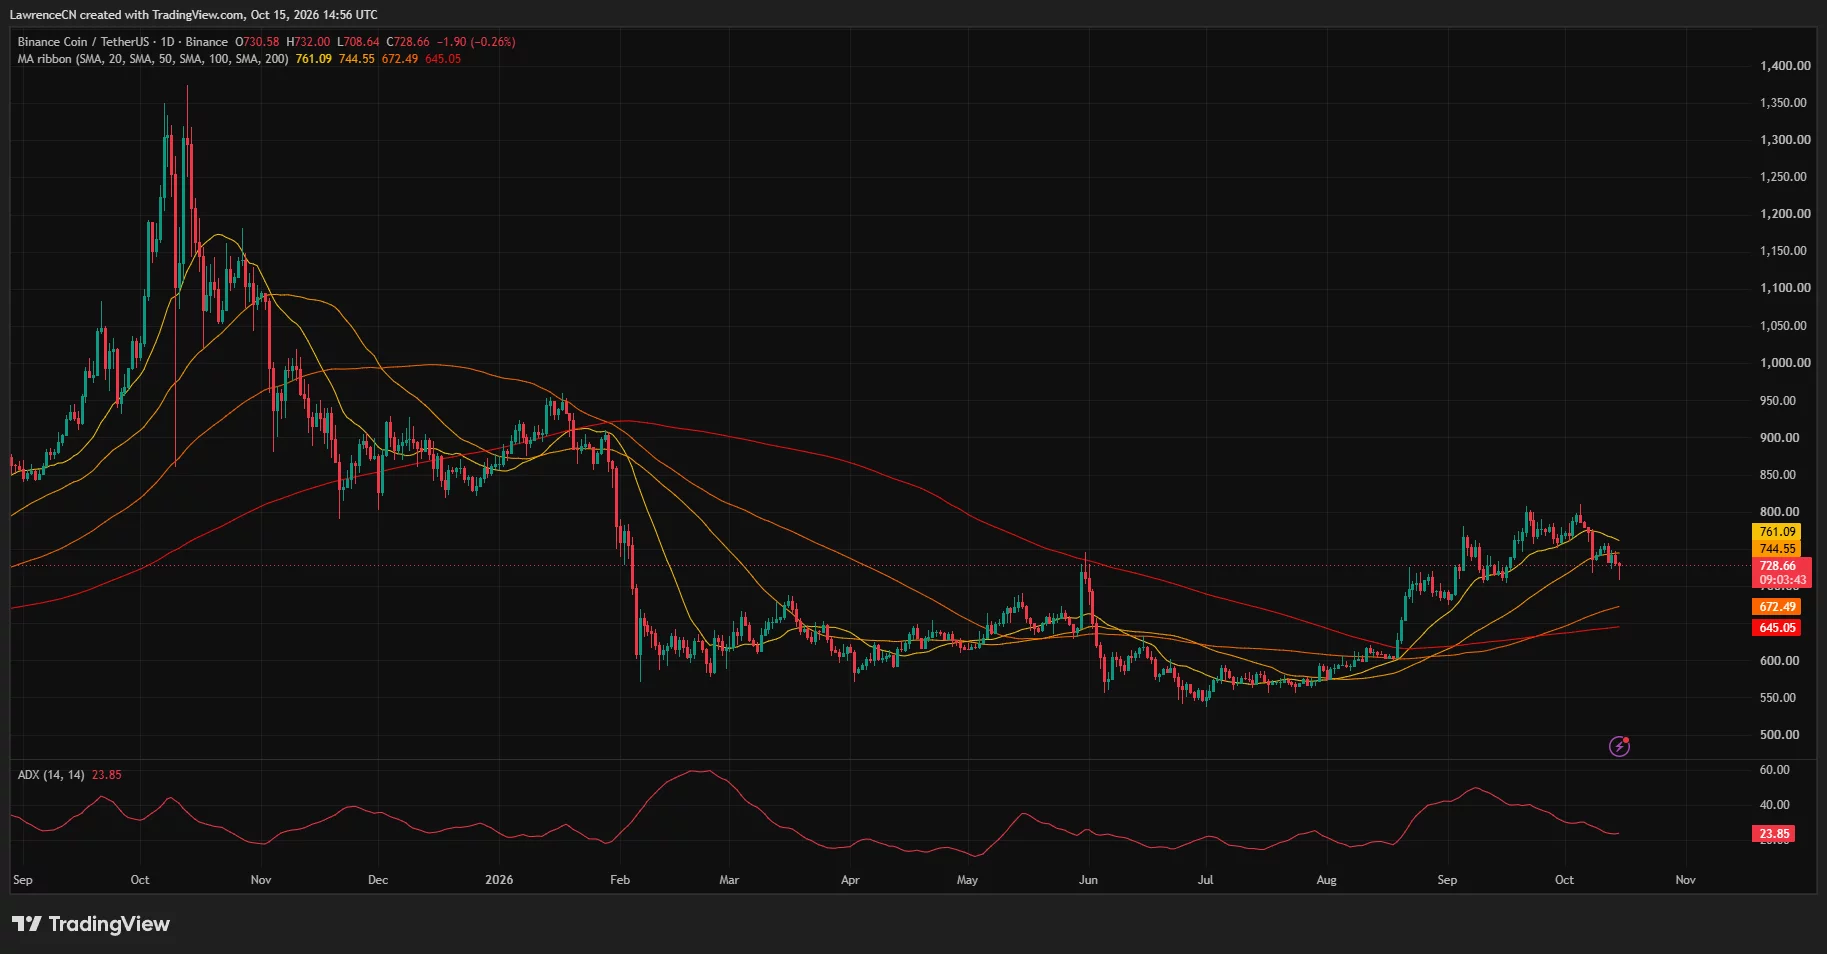
The chart showed a different position against the longer averages. BNB remained above its 100-day simple moving average at $672.49 and its 200-day average at $645.05, preserving part of the advance that began after the summer lows.
At $728.66, the token was approximately 2.2% below the 50-day average and 4.5% below the 20-day average. A return to those readings would place BNB back within the price band lost during the October correction.
The daily Average Directional Index stood at 23.85, down from its September readings above 40. The indicator measures trend strength rather than direction, and its decline accompanied BNB’s retreat from the recent highs.
The weekly Aroon readings retained a different picture: Aroon Up stood at 92.86%, while Aroon Down measured 7.14%. Those readings reflected the recent weekly highs within the indicator’s lookback period, even as the latest weekly price moved lower.
Analysts identify $700–$710 as the next support test
In an Oct. 15 analysis, market commentator BullishBanter identified the $790–$810 area as a supply zone where BNB faced rejection before losing a rising trendline.
The analyst’s 4-hour chart marked two peaks near the upper boundary and a subsequent decline toward a shaded support area around $700–$710. BullishBanter said a break beneath that area would make a further move toward $680–$690 more likely.
“For now, I’m watching 700 support vs 740 reclaim for the next move.”
The analyst’s $740 recovery threshold sits just below the daily 50-day moving average at $744.55. Above that, the weekly Murrey Math pivot at $750 and the 20-day average at $761.09 form additional reference points on the TradingView charts.
Analyst Ed NL also maintained a corrective outlook. In a separate update, the analyst described BNB’s preceding advance as a completed five-wave move and said the token was progressing through a three-leg correction toward lower liquidity.
Ed NL’s chart projected another downward leg after the recent rebound. The forecast remained conditional on that wave interpretation, while BullishBanter supplied the clearer near-term price thresholds at $700, $740 and $680–$690.
Liquidation concentrations sit near $705 and $765
CoinGlass’s one-week BNB liquidation heatmap showed the price falling from the mid-$750s earlier in the period toward the low-$710s before recovering toward $730.
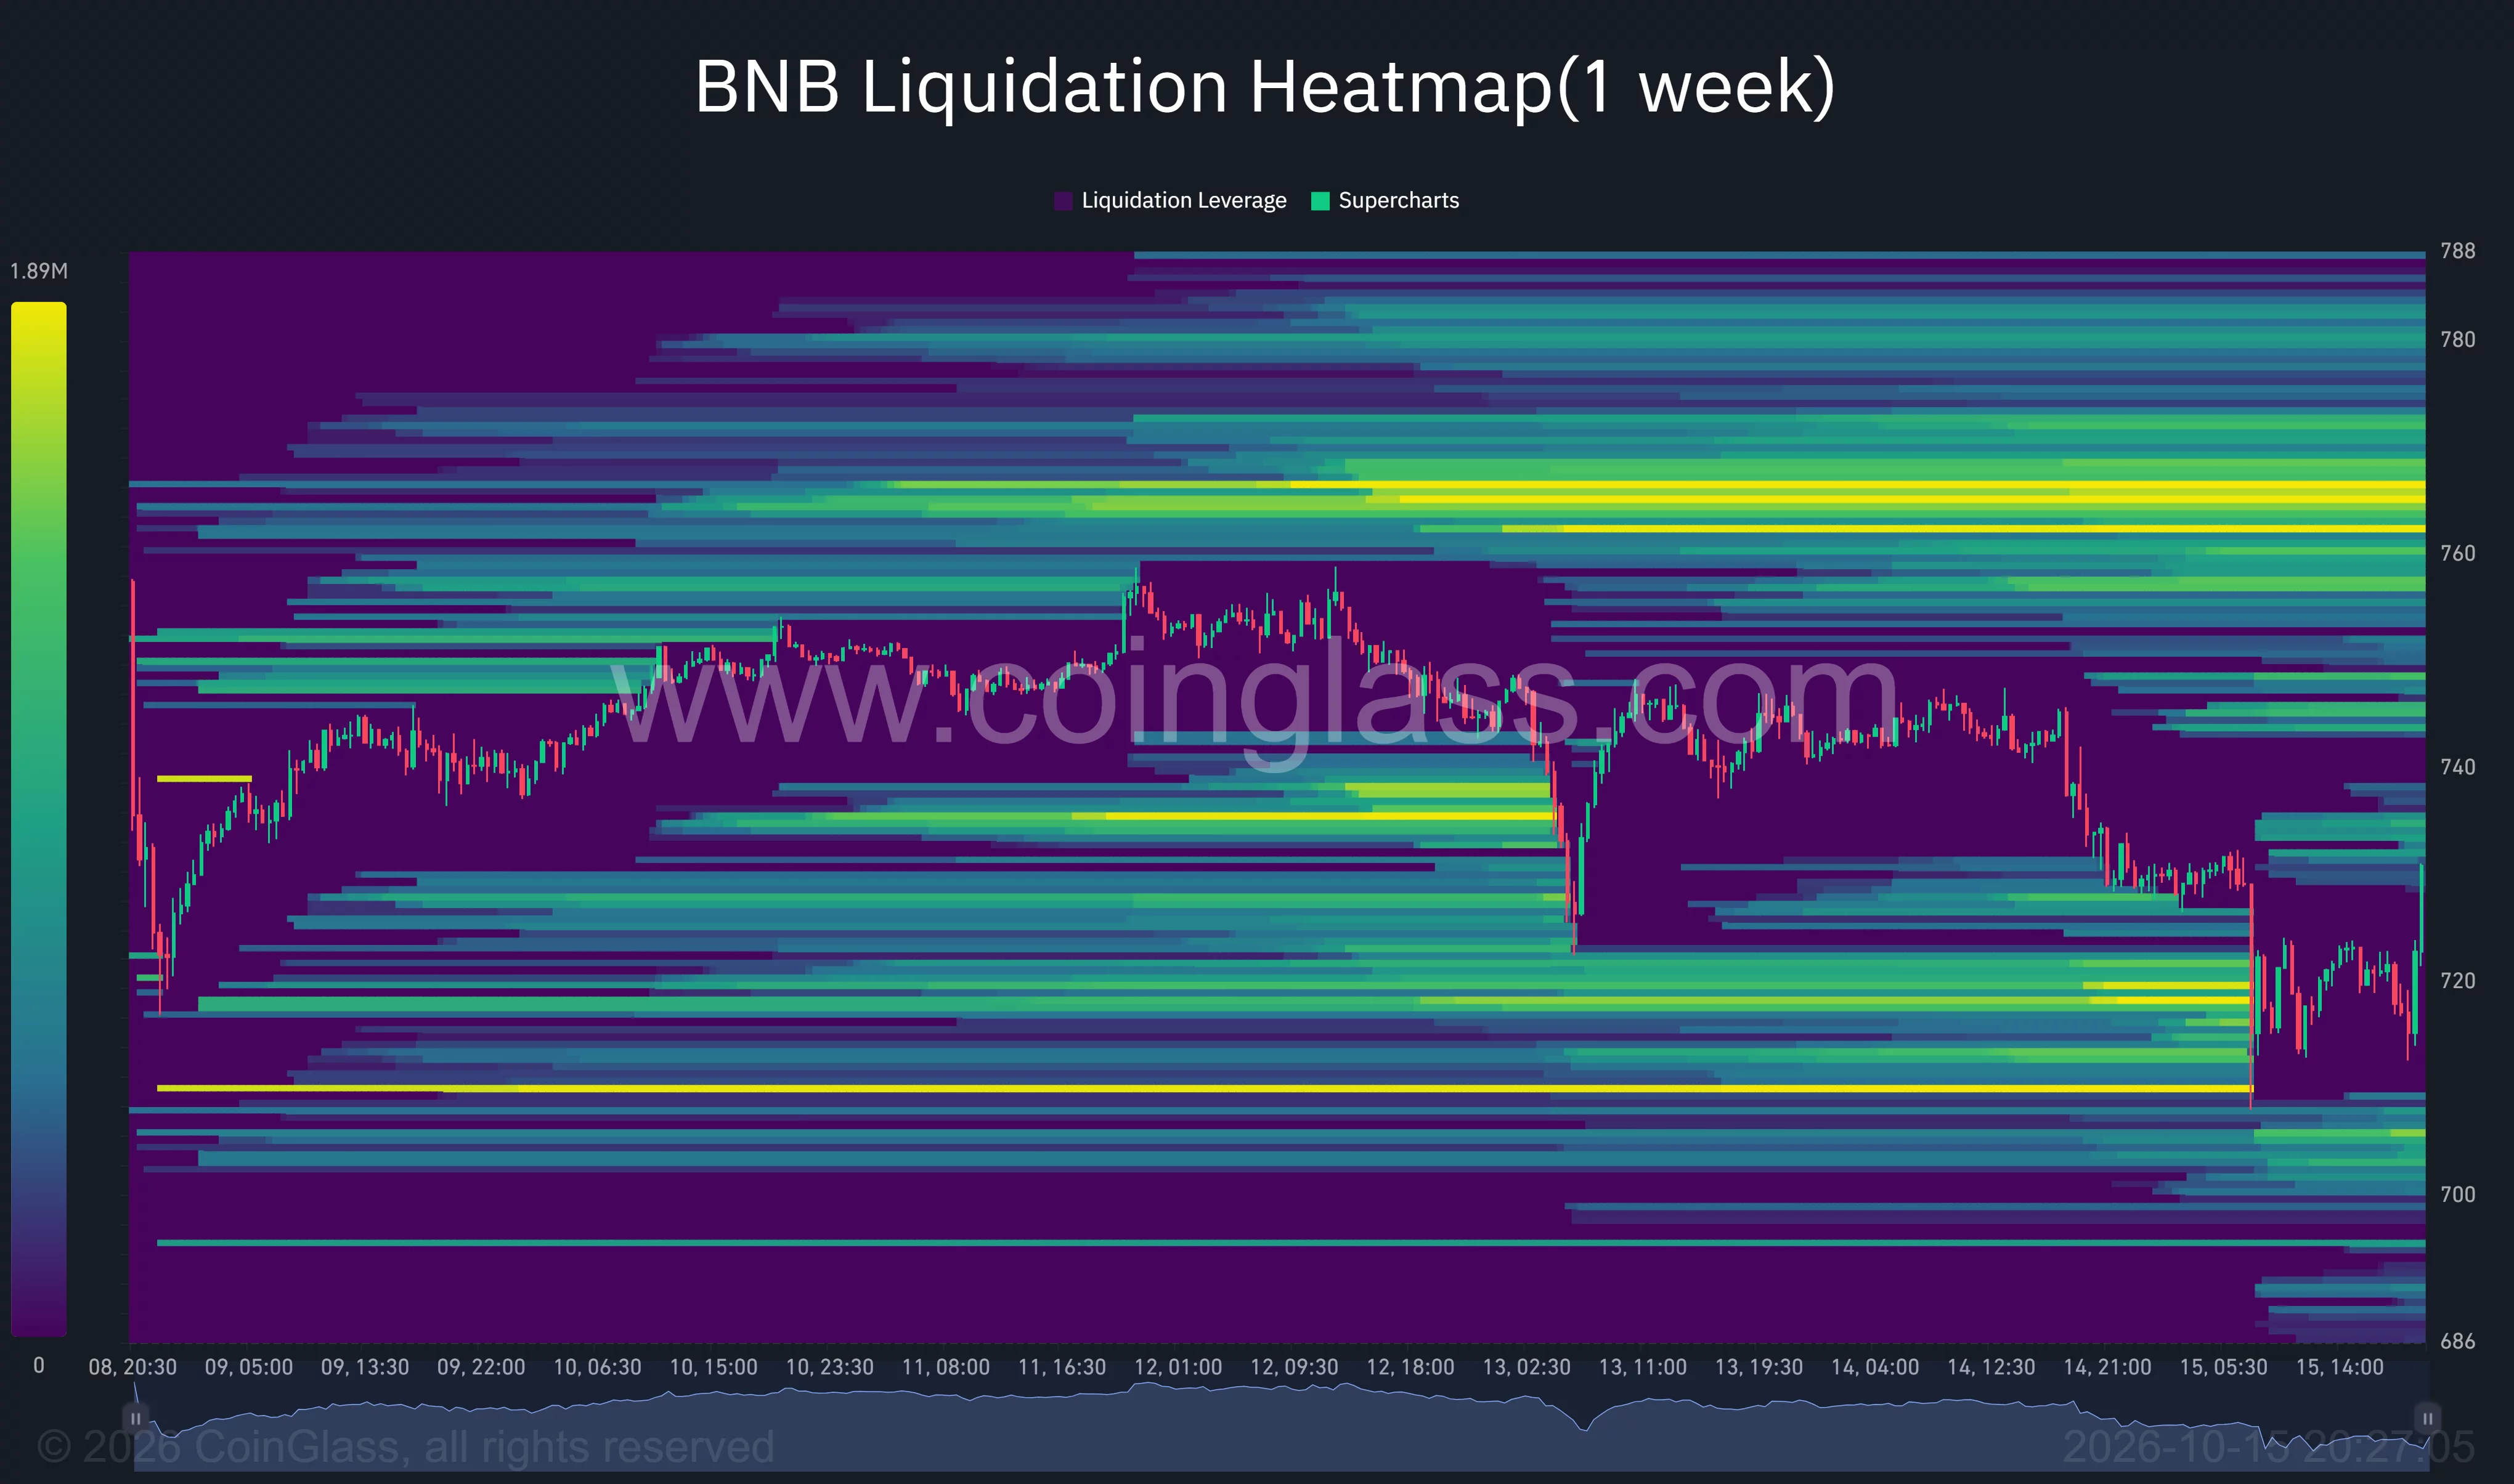
At the right edge of the heatmap, concentrations of estimated liquidation exposure appeared around $704–$706, with another band near $695. Both sat beneath the $708.64 low recorded on the TradingView daily chart.
Above the market, the brightest remaining concentrations appeared near $765–$766, with another prominent band around $762. Higher clusters extended through approximately $772–$780.
The upper concentrations overlapped the area just above BNB’s $761.09 daily moving average. Meanwhile, nearer bands around $733–$735 sat between the rebound price and BullishBanter’s $740 recovery threshold.
CoinGlass’s price trace also showed repeated declines during the week, including a sharp move lower on Oct. 13 and another sell-off on Oct. 15. The latest rebound had returned BNB toward $730 while leaving the earlier trading area around $740–$750 above the market.
US inflation adds a policy catalyst to BNB’s correction
The US Bureau of Labor Statistics reported that September consumer prices rose 3.7% from a year earlier and 0.6% from August. Gasoline prices increased 9.1% during the month and accounted for more than half of the monthly headline increase.
Reuters reported that the release pushed expectations for an October Federal Reserve rate increase higher, while US stocks fell and Treasury yields rose. The report placed the Fed’s Oct. 27–28 meeting at the center of the next US policy decision.
Against that backdrop, the TradingView charts placed BNB below its $750 weekly pivot but above its $672.49 and $645.05 longer-term daily averages. BullishBanter’s near-term scenario hinges on whether $700–$710 holds: the analyst identified $740 as the recovery threshold and $680–$690 as the next downside area if support fails.
Disclosure: This article does not represent investment advice. The content and materials featured on this page are for educational purposes only.